
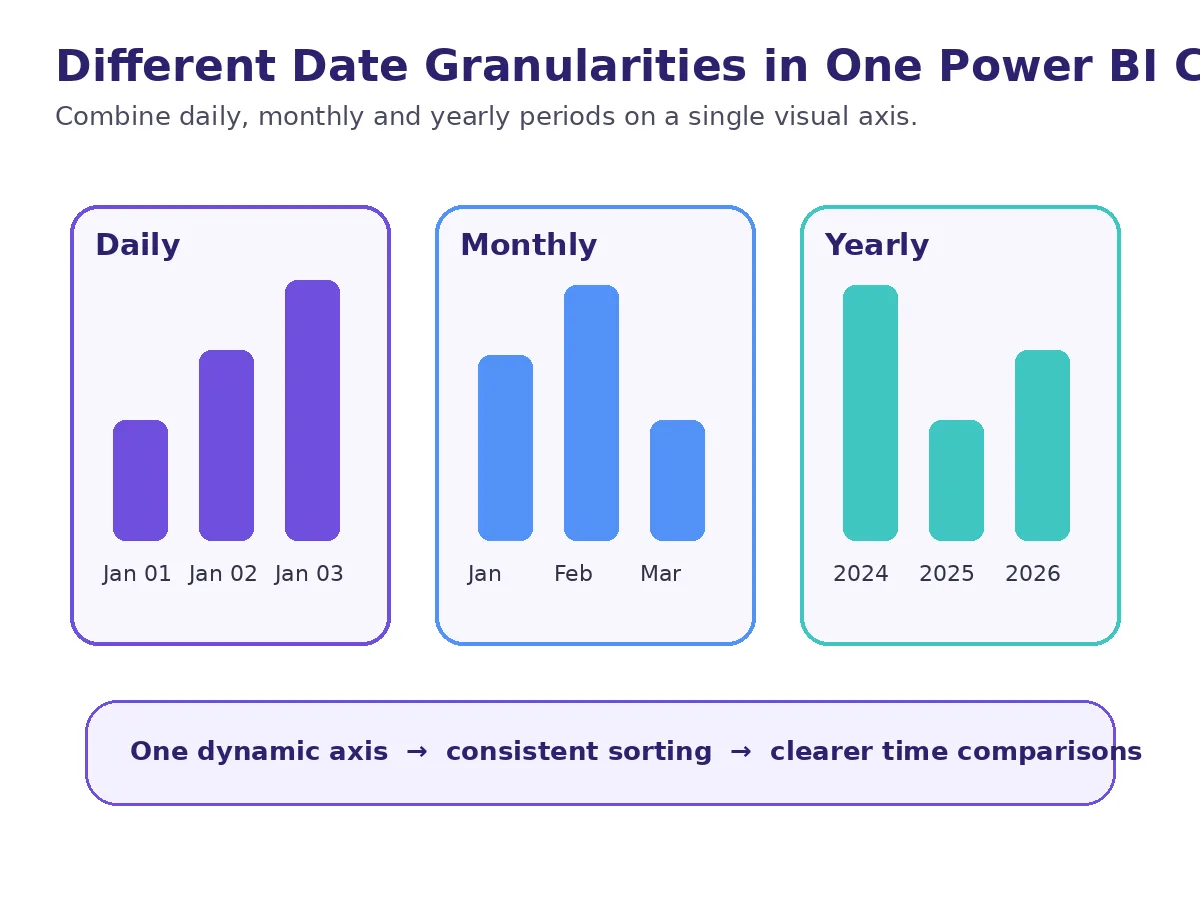
In Power BI, time series are usually displayed at a single detail level such as year, quarter, month, or day. However, in some management reports, it may be more meaningful to summarize past periods and show the current period in more detail.
For example, we might want to show the past years at the year level and the last year at the monthly level on the same axis. The main problem here is not drawing the graph; Combining different time levels on a single logical axis and displaying them in the correct ordertire.
Start with a well-designed date dimension
The foundation of such a display is a regular date table. Having the year, month, period label, and the sorting keys in the same date dimension makes the report logic independent and manageable from the fact table.
The logic of combining different levels on a single axis
Only one axis for the axis to be used in the graph Period The area is created. This area represents the year in some periods and the month in other periods according to the reporting requirement. Thus, while using a single visual area, different date detail levels in the background converge on the same axis.
The important design decision here is which period is summarized and which period is shown in detail. In the example, the last year is shown as monthly, previous years as annual; however, the same approach can be adapted to different needs such as showing the last few months as daily and previous periods as monthly.
Why do you need a separate sort column?
When different labels such as year and month are combined in the same text field, Power BI can evaluate these values not according to their natural chronological order, but according to their text order. Therefore, the key that will be used in the ranking must be separated from the visible label.
The solution is to create a separate sorting area that represents the real-time location of each Period value. A comparable date key can be used for the year label, such as the start of the year for the month label. Subsequently, the Period field is sorted according to this key.
What is the real value of this approach?
The mixed timeline axis ensures that the report maintains both the context and the current detail over long time intervals. The user can see the recent movement in more detail without losing the trend of the past period.
This technique is not just a visual solution; it is also a beautiful example of how a well-designed date dimension can make the reporting behavior flexible. When the need is properly defined, the same logic can be adapted to different granularity combinations.
Power BI data model for support in DAX and report design BI & Power BI Consulting You can review our service.