
The product tree or BOM (Bill of Materials) is a hierarchical structure that shows which sub-products, semi-finished products, and raw materials make up a final product. However, what makes the BOM valuable from an analytical perspective is not just showing the list of components; It is to convey the relationship between the upper product and the lower component correctly and the effect of quantity.
What is the fundamental problem in the product tree?
A material can be used at different points in the product tree or in different end products. Moreover, different amounts of use may exist at each level. Therefore, a flat BOM table is often not sufficient for reporting purposes.
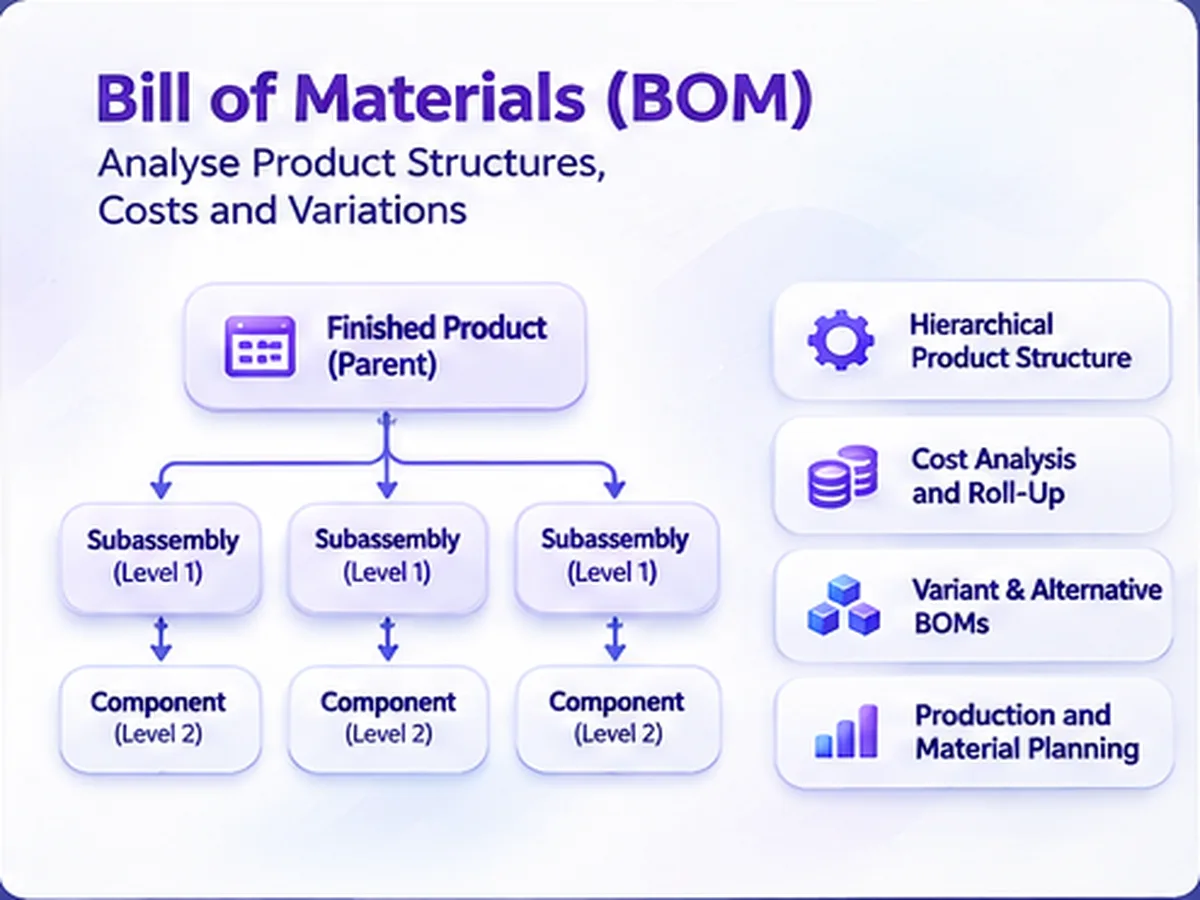
The question we want to answer on the reporting side is usually broader than “what components are under this product?” The real need is to understand what components are needed for a specific final product, how the same component affects which products, and how changes in the hierarchy are reflected in the stock or cost side.
Making BOM data reportable
The example uses the product and Bill of Materials tables in the AdventureWorks database. In the source system, the relationships between the parent product and the sub-components are kept on a row-by-row basis. To create a more comprehensible hierarchical report in Power BI, this parent-child structure must be converted into reporting levels.
Power Query is a suitable layer for this transformation. The goal is not to open the product with only the level names; it is to preserve how each component is connected to the final product via which path and how the quantity effect is carried along this path.
The logic of quantity and hierarchy must be considered together.
One of the critical points in the product tree is not to look only at the quantity in its own row when calculating the need of a lower-level component. The usage quantities at the upper levels also have a chain-like effect. Therefore, the actual need quantity is found by jointly evaluating the multipliers formed throughout the hierarchy.
This approach solves two problems at the same time: it prevents the display of meaningless empty levels in hierarchies, and it allows each component to calculate the actual quantity of need at the correct level.
What is DAX here for?
On the DAX side ISINSCOPE and ISBLANK functions such as these can be used to understand the user's hierarchy level and to control the value that should be displayed at that level. The main purpose here is not to use the function, but, It is to match the level context in the image with the measurement logic.
In terms of quantity, the goal is not to memorize a specific DAX formula. The healthy solution is to evaluate the user’s hierarchy level, the current component at that level, and the quantity impact from higher levels together.
How should the product tree be visualized?
There is no single correct visual. While the matrix may be more suitable for operational listing and quantity comparison; the Decomposition Tree can be used to explore the structure and examine component relationships step by step. The visual selection should be based on the business question.
Which decisions are supported by BOM analysis?
When the product tree is correctly modeled, it no longer remains merely a technical structure. Questions such as which products are affected by stock shortages, which products a specific component is used in, material requirements according to the production plan, and the impact of component costs on the final product cost can be answered through the same analytical model.
When BOM data is combined with ERP, inventory, purchasing, and production transactions, it transforms into a powerful data model that supports production and supply decisions.
To analyze production, inventory, purchasing, and shipment data in a common model Manufacturing & Distribution Our solutions are for Power BI modeling and reporting needs BI & Power BI Consulting You can review our service.