
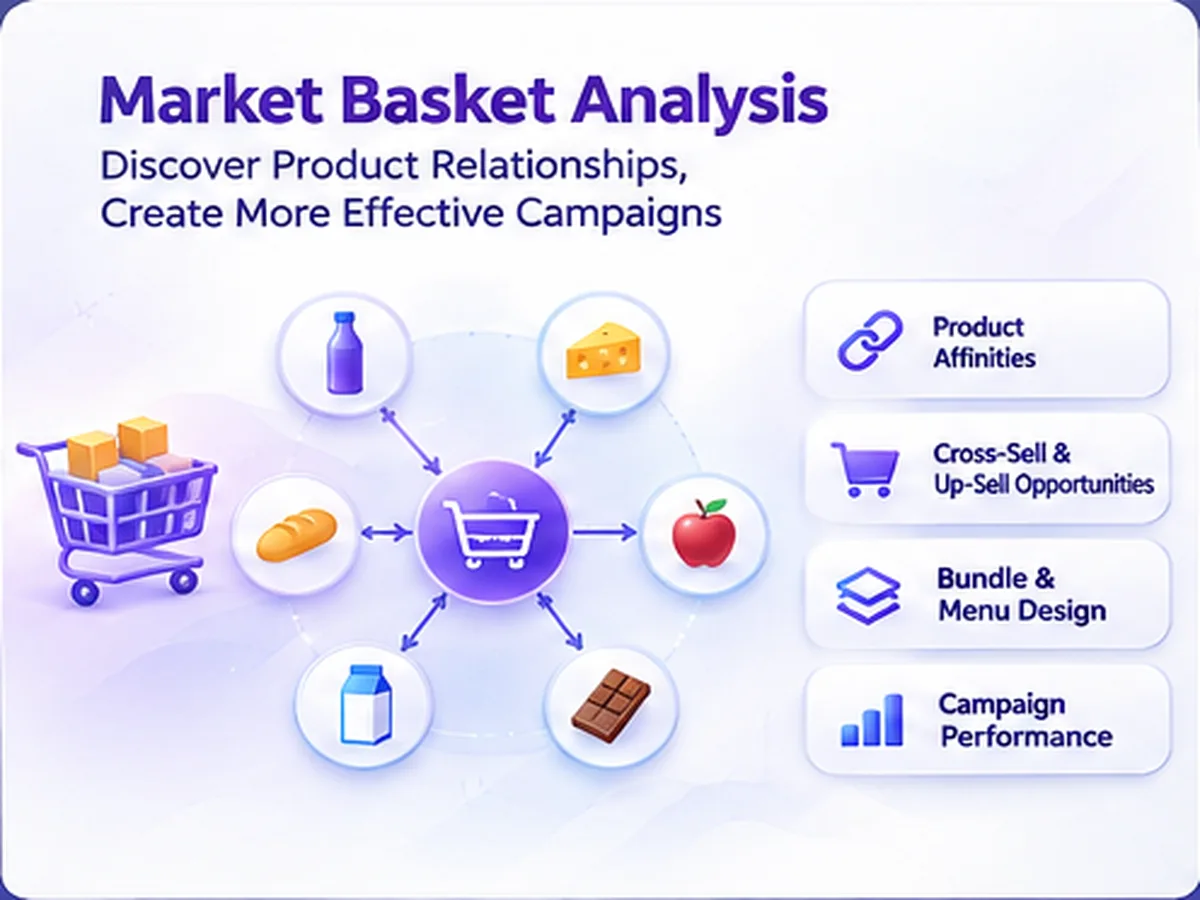
Basket analysis (market basket analysis) is an analysis method used to understand which products customers tend to buy together within the same transaction, order, or purchase. It supports decisions such as cross-selling, promotions, product placement, menu design, and inventory planning, especially in structures where there are numerous product movements, such as retail, e-commerce, and restaurants.
The basic logic of basket analysis
The purpose of the basket analysis is not merely to answer the question “are the two products sold together?” The main goal is to understand how common this combination is, how the likelihood of seeing the other product changes when a product is selected, and whether the observed relationship is above the expected coincidence.
The most frequently used concepts in this assessment support, confidence and liftThe support shows the prevalence of seeing both products together within the overall transaction volume, the tendency for one product to be seen when the other is selected, and the significance of this relationship relative to the probability of independent viewing of the products.
The important point is that these measures do not in themselves indicate causality. The combination of two products does not mean that one led to the purchase of the other. Results should be evaluated in conjunction with price, campaign, channel, branch, customer segment, and period effects.
How to handle basket analysis with Power BI?
The following example shows a basket analysis report created in Power BI. The goal here is to compare the behavior of other products seen within the same transaction when a specific product is selected.
The thinking behind the analysis is quite simple: the transactions of the selected product are evaluated in a separate context, followed by comparing the other products seen in the same transactions with this context. Thus, focus is not only on the sales volume, but also on the behavioral relationships between the products.
Why is the data model important?
When a product is selected, the product dimension needs to take on a second role to analyze the other products sold in the same transaction. For this, a second copy of the product table or a similar role-playing approach can be used. Thus, the “selected product” and the “products sold together” can be handled on the same fact table under different filter contexts.
In the DAX case, the basic trading volume, the trading context of the selected product, and the combined transactions are calculated separately. Indicators such as support, confidence, and lift are derived from these basic measurements. The key value here is much more important than memorizing the formula. which filter context represents which business question It is to establish the right order.
Which decisions are supported by basket analysis?
The business value of basket analysis is in being able to translate product relationships into decision processes. Products purchased together can be used in cross-selling recommendations, package promotions, store or menu layout, and inventory planning. When the same analysis is repeated across branches, channels, or customer segments, behavioral differences also become apparent.
The healthiest approach is to evaluate basket analysis results in conjunction with other indicators such as sales volume, profitability, stock status, campaign impact, and customer segment. This way, you can answer not only the question “which products are sold together,” but also the question “what does this relationship mean from an operational perspective.”.
For establishing similar analytical models on Power BI, improving the data model, or resolving performance issues BI & Power BI Consulting You can review our service. For retail-oriented usage scenarios, please also Retail & Multi-site Operations You can take a look at their solutions.