
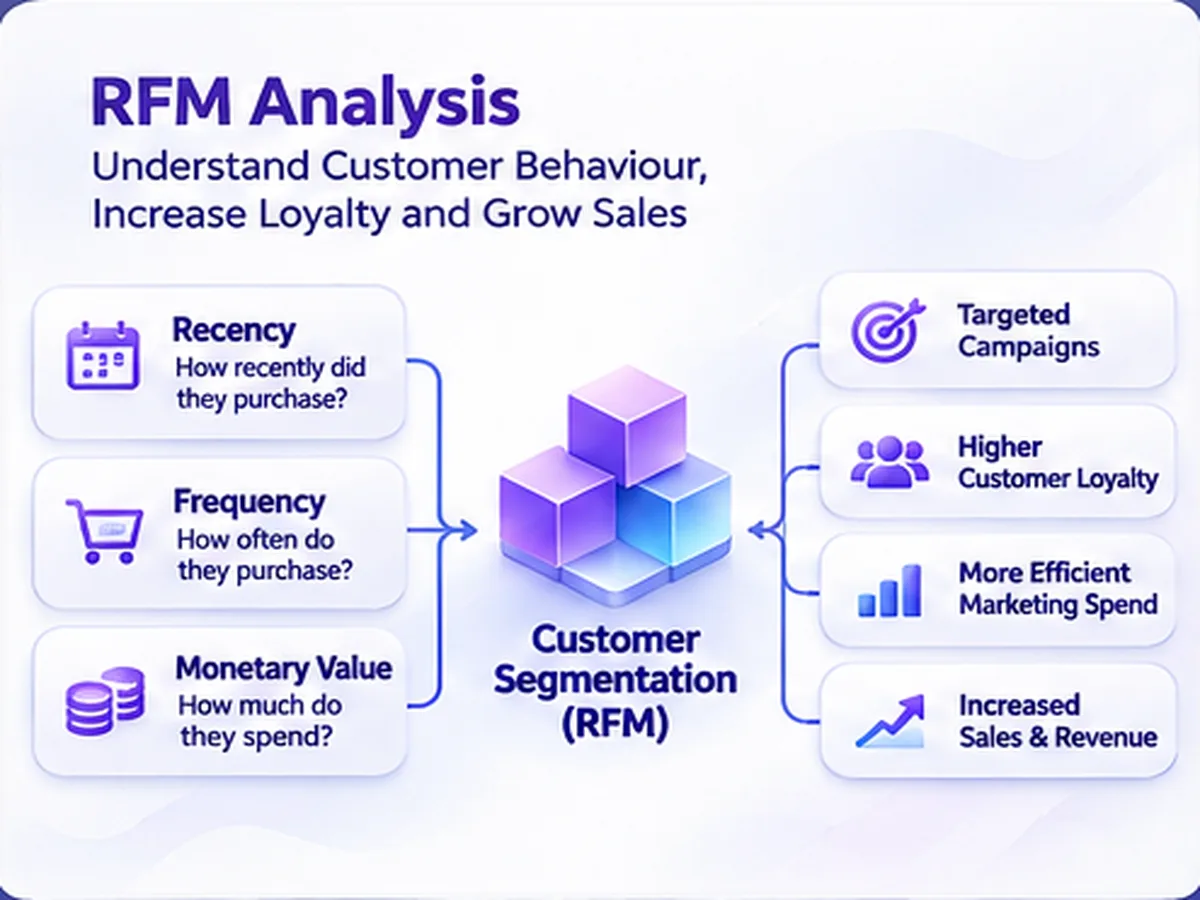
RFM analysis is a practical and understandable method used to segment customers based on their buying behavior. It takes its name from three basic dimensions: Recency, Frequency and Monetary. Together, these dimensions show how recently customers bought, how often they buy and how much they spend.
What does RFM try to understand?
Recency, When the customer last transacted with the business; Frequency, How regularly or frequently they shop during a given period; Monetary represents the monetary value it creates.
When these three dimensions are taken together, it becomes apparent that two customers with the same total spend may actually have very different behaviors. One may be making frequent and regular purchases recently, while the other may be passive for a long time. The value of RFM is exactly what makes this difference visible.
It's not about scoring points; it's about behavioral logic.
In RFM applications, these three values are often converted into scores. However, the scoring ranges to be used are not universal. The data distribution varies according to sector, customer lifecycle, and business model. On the recency side, closer dates often indicate a stronger relationship, while on the frequency and monetary side, high values are considered more favorable in most scenarios.
Therefore, a good RFM model should create segment boundaries that reflect the organization’s own customer behavior rather than the “apply the same thresholds to every customer” approach.
How are customer segments interpreted?
When RFM scores are combined, customers can be divided into behavioral groups. For example, customers who have recently made purchases, are regular and generate high value can be placed in strong segments such as “Champions.” Customers who were active in the past but have recently withdrawn can be evaluated in re-acquisition-oriented segments such as “At Risk.”.
What is more important than segment names is defining what each group means in terms of business and which actions are appropriate. Decisions such as loyalty, repeat purchases, campaign prioritization, and frequency of communication can be based on this behavioral logic.
How to model RFM analysis with Power BI?
In the example, a historical retail data set was used. In such a data set, the first step is to build a reliable transaction history based on the customer. Records such as returns and cancellations should be separated according to business rules; the customer, transaction date, and monetary value fields should be made consistent.
What matters in the recency account is comparing all customers against the same reference date. In a live system, this date may be current; in a historical sample data set, however, it is necessary to determine a meaningful reference based on the data set’s last transaction period.
After basic measurements are calculated by Power BI, customers are divided into segments based on data distribution or business rules. The main design decision here is not the DAX expression used, but rather the data source used. correctly establishing the business meaning of segments and to ensure consistent monitoring over time.
The business value of RFM analysis
RFM makes behavioral differences visible rather than evaluating the customer base based on a single average. This allows loyalty programs, reactivation campaigns, and customer communication to be designed more purposefully.
RFM is a strong starting point, but it alone does not explain all of the customer value. A stronger customer analytics model emerges when it is considered alongside metrics such as channel, product category, profitability, discounting dependency, lifetime value, and campaign responsiveness.
Solutions for customer analytics, data modeling, and segmentation on Power BI BI & Power BI Consulting Our service is for retail-oriented analytical scenarios Retail & Multi-site Operations You can review our solutions.